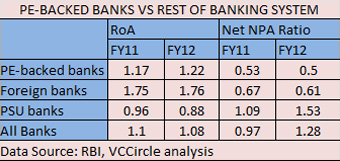
Banks, which count private equity investors among its shareholders, trimmed the proportion of non-performing assets (NPAs) on their balance sheets, improved the return on assets and outgrew the rest of the banking sector in terms of both deposit and advances (or loan) growth during FY12, according to a VCCircle study.
Although some private equity investors had invested in new-generation private lenders way back and either remain invested or have recently cut their exposure, many others developed a particular fancy to the old-generation private banks in the country over the past two years. To be fair, PE investors’ bet on these banks would be validated by the returns they eventually make, but the operational performance indicates these investments are not misguided.
Most of the PE investments in the banking space have come through the secondary market, which means shares were purchased from the open market. Funds like General Atlantic, ChrysCapital, Carlyle Group, Olympus Capital Holdings, Norwest Venture Partners, Bessemer Venture Partners and MCap Fund Advisors have used this route. In some others banks like Development Credit Bank and privately held Ratnakar Bank, the investors came in through preferential allotment.
The VCCircle study has clubbed sovereign wealth funds, along with pure PE firms, while counting banks backed by PE firms as an investor class. This covers a set of 17 private banks including both old-generation and new-generation lenders – almost all of which are public-listed. We have drawn on the data compiled by the RBI on various performance parameters over the past few years.
 The study shows that the PE-backed firms recorded better return on assets (RoA) that nudged up to 1.22 per cent as against a drop in the RoA of the overall banking system to 1.08 per cent. Even as the old-generation private banks pulled down the overall performance with minor gains, newer private banks held the overall ratio for the PE-backed lenders. In contrast, foreign banks also notched marginal growth but the RoA slipped for the PSU banks.
PE-backed banks with better-than-average RoA last year included Federal Bank, City Union Bank, Karur Vysya Bank, Ratnakar Bank, HDFC Bank, ICICI Bank, Kotak Mahindra Bank and Yes Bank, although some like Karur Vysya Bank and Yes Bank saw the RoA decline marginally over FY11.
Weighed by the net NPAs or bad loans, again PE-backed firms appeared on a stronger footing, clipping their average net NPA to 0.50 per cent as against 0.53 per cent during FY11. Compared to this, the net NPA ratio of the overall banking sector rose to 1.28 per cent.
The deteriorating performance of overall banking system on bad loans was largely attributed to PSU banks and in particular, to SBI and its associates, which saw the net NPA ratio at 1.76 per cent, the highest in the last five years.
Deposit growth of PE-backed banks pegged at 17 per cent was also higher than the sector average while advances grew 21 per cent, as against 18 per cent growth clocked by the sector. This also reflected in better growth in both interest income (39 per cent versus 33 per cent) and ‘other income’, which at 18 per cent, was over twice the growth rate for the banking system overall.
This was despite the spiralling cost of funds for these PE-backed banks that rose some 150 basis points to an average of a little over 7 per cent. As against this, the average cost of funds for the sector rose from 4.75 per cent to 5.9 per cent between FY11 and FY12, according to the RBI report.
One area where the PE-backed banks slipped was in capital adequacy ratio (capital to risk weighted assets ratio or CRAR). These banks saw the CRAR drop from 17.2 per cent to 15 per cent between FY11 and FY12 when the banking system saw it improve to 14.25 per cent.
Also read:
(Edited by Sanghamitra Mandal)


