The question
The erstwhile GDP series, with a base year of 2004-05, has been discontinued. The new series has a base year of 2011-12. On paper, the Central Statistical Organisation (CSO) has made improvements in methods for the new series.
A significant debate is taking place about the soundness of the new data, on two counts. First, some experts, such as Prof. Nagaraj of IGIDR, have expressed concerns about the methods used in the new series. Second, the new series seems out of sync with other directly measured indicators.
This methodological debate about GDP measurement comes at a time when the question of the age is: Has India recovered from the business cycle downturn which began in 2012, or has that downturn continued into the present? The high growth rates visible in the new GDP data suggests that the downturn has, indeed ended.
A trusted output proxy
The output measure which is unambiguously well measured is the sum of revenue of listed non-financial non-oil firms, drawn from the CMIE database. SEBI regulations require that listed companies release quarterly summary financial statements. We see records for every firm, so there is no opaque methodology for extrapolation. It's mere addition of unit level data.
Financial firms are excluded as their accounting concepts are not comparable with non-financial firms. Oil firms are excluded as their output fluctuates a lot owing to changes in the petroleum product subsidy regime and the fluctuations of the world oil price.
We construct an index as follows. For each pair of consecutive quarters $t_1$ and $t_2$ we identify the firms $I_2$ which are observed in both quarters. We sum up the net sales at both time points to get $y_1 = sum_{i in I_2} y_{i,1}$ and $y_2 = sum_{i in I_2} y_{i,,2}$. This yields an estimate of the growth $y_2/y_1$. These percentage changes are cumulated to make a nominal index and then seasonally adjusted.
This yields a quarter-on-quarter seasonally adjusted nominal growth rate. This is an unambiguously well measured output growth, which does not require getting into debates about measurement of inflation, or the CSO's procedures for measurement of GDP. This series is observed from 1999 onwards.
This output proxy is useful because the listed companies are an important subset of the economy. As an example, a large fraction of the taxes paid by all firms emanate from these firms. Many Indian laws are excessively restrictive on large firms. This has created incentives for large firms to organise themselves as a hub of contracts, where many elements of production are done by satellite firms. I have anecdotal evidence about one large listed firm: for each employee seen on the books of the large firm, there are two employees in the surrounding ecosystem of small firms where sub-components of the production process are contracted out. Hence, a particularly large swathe of the economy is observed when we see the output of these large firms.
Identifying recessions in this data
The heuristic used for identifying downturns is to look for a contiguous period of substantially below-median growth of which at least one quarter has near-zero nominal growth. This yields the following dates of recessions:
1.Q4 2000 to Q1 2002, the downturn that was associated with the IT bust and the 9/11 attacks.
2. Q4 2008 to Q1 2009, the downturn associated with the global crisis.
3. A downturn that began in Q1 2012.
This is not the NBER approach of identifying peaks and troughs. In a high growth economy like India, we get growth cycles and not business cycles in the conventional sense of the term. Hence, for the purpose of identifying dates of recessions, it is more interesting to identify the periods of extremely low growth.
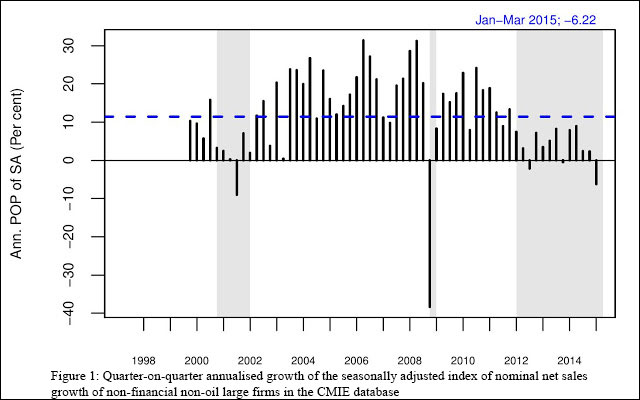
The graph above shows seasonally adjusted quarter-on-quarter nominal growth of the revenues of large companies. This shows sluggish growth all through the present downturn. In the Jan-Feb-March 2015 quarter, growth was particularly weak.
This is the measure of macroeconomic conditions that involves the least assumptions about measurement. It admittedly only measures what is going on with the large firms. So far, we have not shifted from nominal to real.
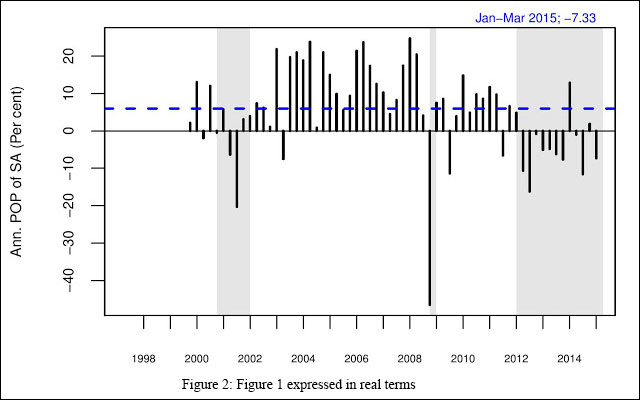
The graph above shifts from nominal to real, using CPI-IW as the measure of inflation. The broad picture observed is similar. Both series suggest that the recession which began in Q1 2012 has not ended.
How does the trusted measure compare against old and new GDP data?
So far, we have looked at quarter-on-quarter seasonally adjusted growth rates. We now switch to year-on-year growth rates, because the new GDP data has a short time series and seasonal adjustment is not possible. We use nominal data to avoid the controversies of converting to real. The key graph is placed below.
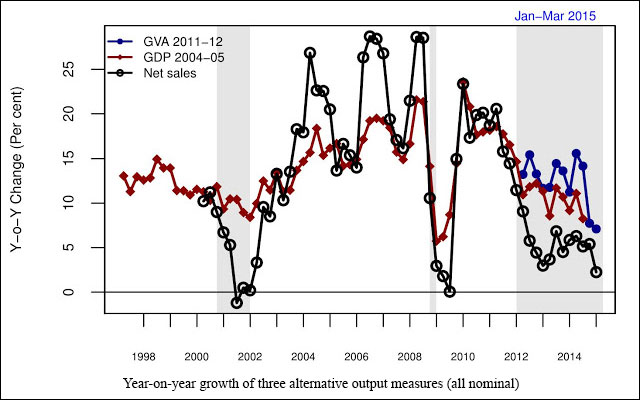
The red line is the old quarterly GDP series, with base year 2004-05. The blue line is the new series with a 2011-12 base. The black line is constructed from firm data. The three recessions are shown as shaded regions. This graph shows three things:
1. Output growth as seen in the sales of large firms has more extreme fluctuations when compared with GDP growth. In good times, revenue growth of firms has gone all the way up to 25% nominal year-on-year growth, and in bad times, this has dropped to near-zero levels.
2. The downturn which began in Q1 2012 has not ended. There was only temporary improvement, perhaps aided by the decline in crude oil prices and the optimism associated with the election outcome of May 2014. The latest data, for January-February-March 2015, is the worst observed within this recession.
3. The new GDP data is more optimistic than the old GDP data.
In the period leading up to June 2012, there was a good agreement between the GDP (2004-05 base) and the firm data. On average, the GDP data was lower by -.39 percentage points.
Something changed in the methods used by the CSO in June 2012 (we know not what). From this date onwards, GDP data (old base) started showing larger values when compared with the firm data, with a gap of +5.1 percentage points.
This gap has risen with new GDP data, where the appropriate and comparable measure is the GVA. This is showing growth which is 7.9 percentage points higher, on average, than the firm sales data.
This evidence does not suggest that the new GDP data is off by 7.9 percentage points. As the graph shows, firm sales data has a bigger amplitude when compared with the GDP data. In good times, the firm data shows very high growth and vice versa. The problem is perhaps limited to the discrepancy between the old data and the new data, which seems to be 190 basis points.
Is growth better with smaller firms?
One element of the methodological improvement made by the CSO in the new data is reaching beyond large firms traded on stock exchanges (``listed companies'' in the Indian parlance) to smaller firms. It is argued that these smaller firms are growing much faster. In order to test this hypothesis, we utilise annual data for a much larger universe of private firms (``unlisted companies'' in the Indian parlance). The CMIE database now has strong coverage of unlisted firms, which makes this analysis feasible.
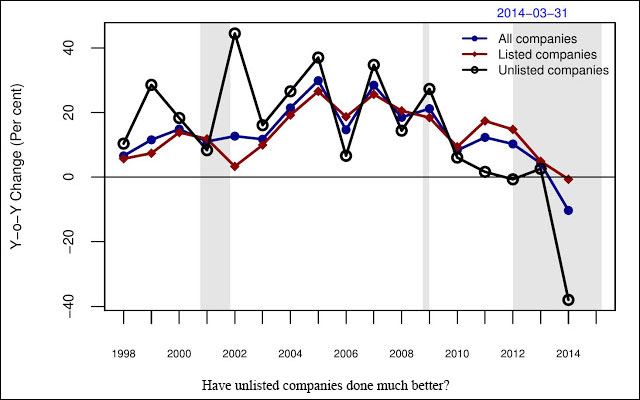
The results show that in recent years, the performance of the unlisted companies was worse. This cannot be an explanation for the high GDP growth seen in the official data.
Corroborating evidence: Export demand
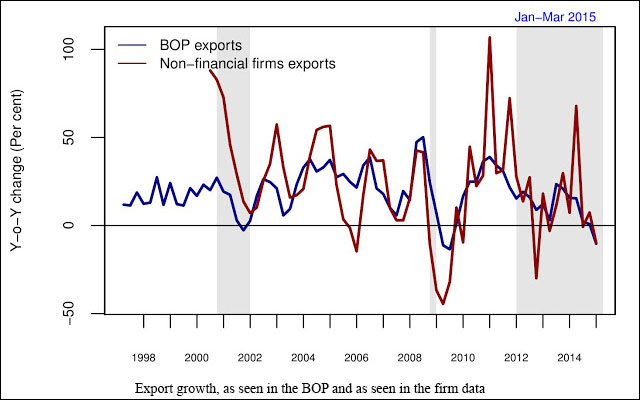
The graph above superposes goods and services exports from the Balance of Payments data against the exports of goods and services seen in the firm data. The BOP data is well measured and hence trustworthy. This gives us an opportunity to compare the picture seen through firm data versus the picture for the full economy. Here also, the large firms often seem to have more volatilility of boom and bust in exports growth, when compared with the overall data.
This shows a period of sluggish exports growth in the post-2012 period.
Corroborating evidence: Investment demand
We obtain trusted evidence about investment by firms through the CMIE Capex database, which tracks all projects presently under implementation.
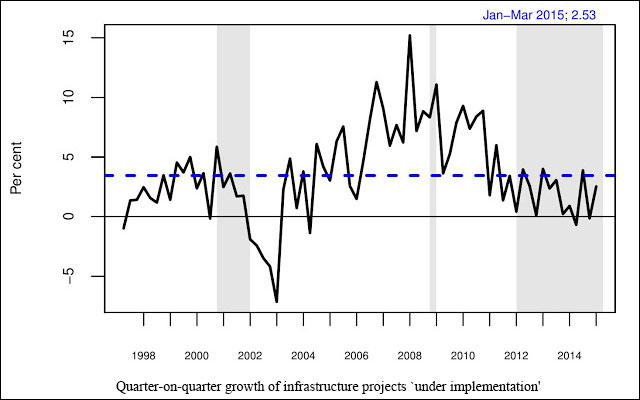
The graph above shows point-on-point growth in infrastructure projects which are classified as `under implementation'. As there is no seasonality in this series, the simple point-on-point growth measure is useful. Many of these projects have been stuck on account of policy bottlenecks, and it was hoped that the new BJP government would be much more effective at removing these bottlenecks. In the period after 2012, in most quarters, the growth has been below the long run median (the dashed line).
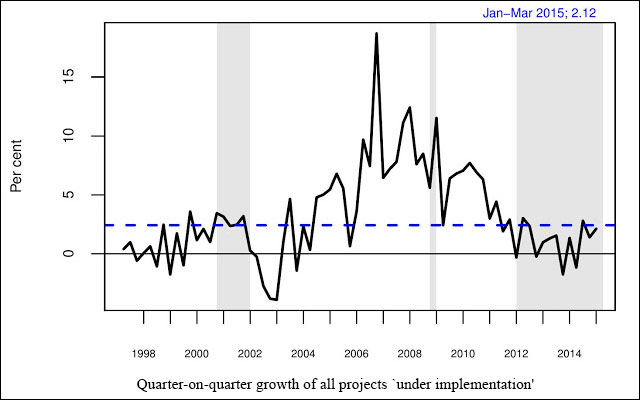
Infrastructure is only one component of overall investment. The graph above shows point-on-point growth in all projects that are `under implementation'. As there is no seasonality in this series, the simple point-on-point growth measure is useful. This shows a slight recovery from the depths experienced prior to the elections. However, we remain near or below the long-run median value (the dashed line).
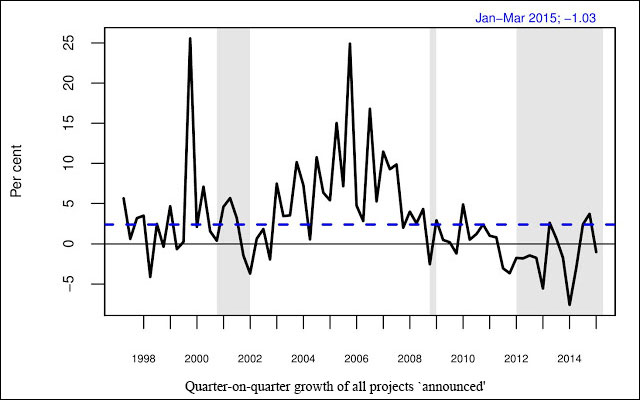
Project announcements are a measure of business confidence. When firms are profitable, and financing is not a constraint, more projects get announced. The graph above shows sluggish growth in project announcements in the third recession. In most quarters, sub-median values have been observed. (There are some methodological issues in how we construct this measure, which tend to slightly overstate growth in the latest quarters).
Conclusion
The new GDP data features many improvements in methodology. However, there is something going on, which we do not yet understand, which is a cause for concern. The extremely optimistic picture shown in the new GDP data does not square against what is seen in other data. Firm data released at quarterly and annual frequencies is micro data where every record can be perused and checked. Investment data is the aggregation of facts about individual projects which can be perused and checked. BOP data is a sound measure of goods and services being sold by India as we measure foreign exchange going into the country.
This examination shows slow growth. Investment data is sluggish. Export demand is sluggish. These are consistent with the most trusted output measure -- revenue growth of large firms.
The picture appears to be one where a recession began in Q1 2012 and has not yet ended.
This article first appeared on Ajay Shah's blog.
(Ajay Shah is a Professor at National Institute for Public Finance and Policy, New Delhi.)


